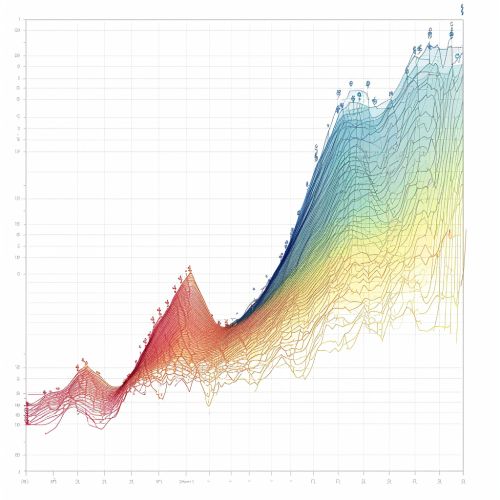
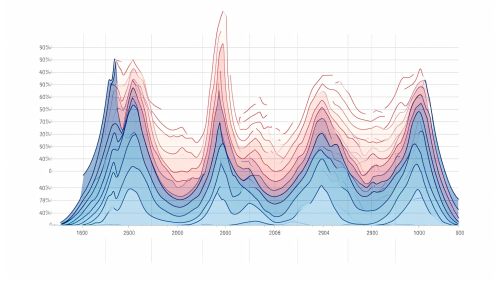
Semivariogram
Introduction
A Semivariogram is a fundamental tool in spatial statistics, used to quantify the spatial correlation structure in geostatistical datasets. It is a plot that describes how dissimilarity varies with distance, providing a crucial input for the prediction of spatially distributed variables.
Definition
The semivariogram, denoted as γ(h), is defined for a random field Z(x), where x is a location in a d-dimensional space, and h is a vector indicating direction and distance. The semivariogram is given by:
γ(h) = 0.5 * E{[Z(x + h) - Z(x)]^2}
where E denotes the expectation operator. The semivariogram is a measure of the average dissimilarity between data values separated by the vector h.


Properties
The semivariogram has several important properties:
- It is non-decreasing with distance. This property, known as the semivariogram property, reflects the general principle that things closer together are more similar than things further apart.
- It often exhibits a range, beyond which the semivariogram value no longer increases with distance. This range is a measure of the spatial correlation length in the data.
- The semivariogram often exhibits a sill, which is the maximum value it reaches. The sill is a measure of the total variance in the data.
- The semivariogram is symmetric: γ(h) = γ(-h). This property reflects the assumption of isotropy, which means that the spatial correlation structure does not depend on direction.
Estimation
The semivariogram is typically estimated from data using the method of moments. The empirical semivariogram is given by:
γ(h) = (1 / 2N(h)) * Σ[Z(x_i + h) - Z(x_i)]^2
where N(h) is the number of pairs of data values separated by the vector h, and the sum is over all such pairs.
Models
Several parametric models are commonly used to fit the empirical semivariogram. These include the spherical, exponential, and Gaussian models, among others. Each model is characterized by three parameters: the nugget, the sill, and the range.
- The nugget is the semivariogram value at zero distance. It represents measurement error or spatial variability at distances smaller than the sampling interval.
- The sill is the maximum semivariogram value. It represents the total variance of the variable.
- The range is the distance at which the semivariogram reaches the sill. It represents the maximum distance of spatial autocorrelation.
Applications
Semivariograms are used in geostatistics for spatial prediction, also known as kriging. The semivariogram provides the weights for the linear combination of data values that gives the best unbiased prediction at unsampled locations.
Semivariograms are also used in spatial sampling design. The range of the semivariogram provides a guideline for the minimum spacing of sampling locations to capture the spatial variability in the variable of interest.
See Also
- Spatial Statistics - Geostatistics - Spatial Autocorrelation - Spatial Analysis
