Spatial Autocorrelation
Introduction
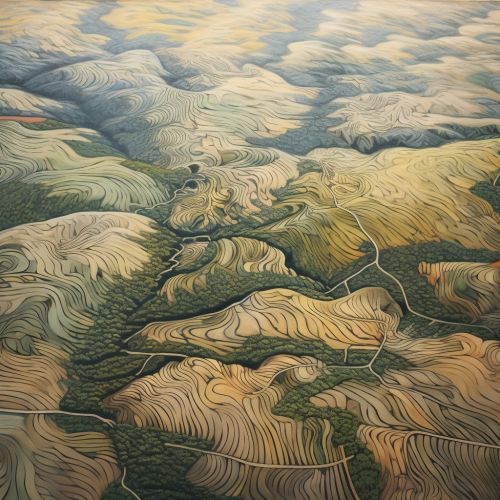
Spatial autocorrelation refers to the degree to which a set of spatial features and their associated data values tend to be clustered together in space or tend to be dispersed. This concept is fundamental in the field of Geographical Information Systems (GIS) and Spatial Analysis, and is often used to analyze spatial data. The concept of spatial autocorrelation is similar to that of statistical correlation, but it involves the correlation of a variable with itself through space.


Understanding Spatial Autocorrelation
In spatial autocorrelation, the correlation is based on the geographic location of the observations. It is a measure of how much the location of an observation influences its value. For example, in a study of housing prices, spatial autocorrelation might reveal that houses located near each other tend to have similar prices. This is because the value of a house is often influenced by the characteristics of its surrounding neighborhood, such as the quality of schools, the level of crime, and the availability of amenities like parks and shopping centers.
The concept of spatial autocorrelation is based on the First Law of Geography, which states that "everything is related to everything else, but near things are more related than distant things." This law, proposed by Waldo Tobler, a prominent geographer, highlights the importance of location in understanding spatial relationships and patterns.
Types of Spatial Autocorrelation
Spatial autocorrelation can be either positive or negative.
Positive Spatial Autocorrelation
Positive spatial autocorrelation occurs when similar values occur together in space. For example, in a map of population density, cities (areas of high population density) are likely to be surrounded by suburbs (areas of moderately high population density), and these urban areas are likely to be separated from each other by rural areas (areas of low population density). This pattern of high-high and low-low values is indicative of positive spatial autocorrelation.
Negative Spatial Autocorrelation
Negative spatial autocorrelation, on the other hand, occurs when dissimilar values occur together in space. For example, in a map of land use, residential areas (high value) might be adjacent to industrial areas (low value). This pattern of high-low and low-high values is indicative of negative spatial autocorrelation.
Measuring Spatial Autocorrelation
There are several statistical methods for measuring spatial autocorrelation, including the Moran's I, Geary's C, and Getis-Ord Gi* statistics. These methods provide a numerical value that describes the degree and type of spatial autocorrelation present in a dataset.
Moran's I
Moran's I is a measure of global spatial autocorrelation. It provides a single value that describes the overall tendency of similar values to cluster together in space. A Moran's I value close to +1 indicates strong positive spatial autocorrelation, a value close to -1 indicates strong negative spatial autocorrelation, and a value close to 0 indicates no spatial autocorrelation.
Geary's C
Geary's C is another measure of global spatial autocorrelation. Unlike Moran's I, which considers the similarity between each pair of observations, Geary's C considers the difference between each pair of observations. A Geary's C value close to +1 indicates strong negative spatial autocorrelation, a value close to 0 indicates strong positive spatial autocorrelation, and a value close to 1 indicates no spatial autocorrelation.
Getis-Ord Gi*
The Getis-Ord Gi* statistic is a measure of local spatial autocorrelation. It identifies areas of the map where high values or low values cluster together. This can be useful for identifying hot spots or cold spots in the data.
Applications of Spatial Autocorrelation
Spatial autocorrelation is used in many fields, including geography, ecology, economics, and public health. It can be used to identify patterns in spatial data, to test hypotheses about spatial processes, and to develop predictive models.
In geography, spatial autocorrelation can be used to analyze patterns of land use, population density, or climate. In ecology, it can be used to study the distribution of species or the spread of diseases. In economics, it can be used to analyze patterns of economic activity or the distribution of resources. In public health, it can be used to identify clusters of disease or to analyze patterns of health service use.
