Thematic map
Introduction
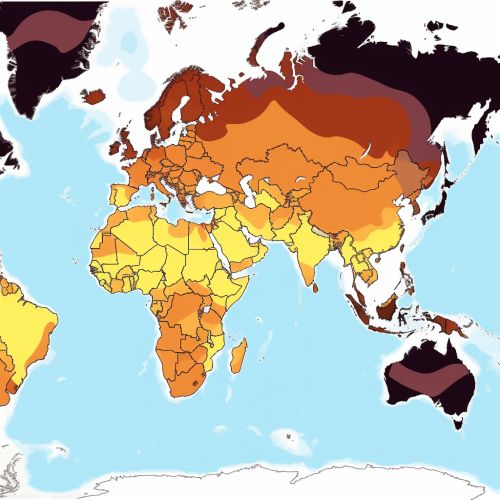
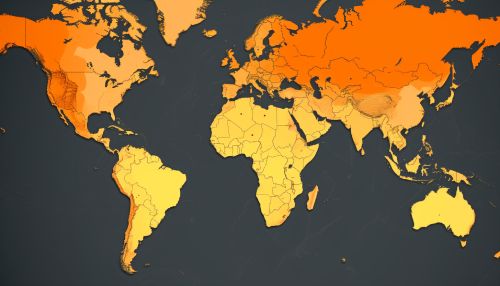
A Thematic map is a type of map or chart especially designed to show a particular theme connected with a specific geographic area. These maps "paint a picture" of the geographic patterns of a particular attribute or attributes in a geographic area. They are different from general reference maps, which tend to display a variety of physical and cultural features without focusing on one particular attribute or theme.
History
The concept of thematic mapping has its roots in the 17th century, when maps began to be used as a way to visualize a variety of factors such as climate, vegetation, geology, and population density. The first known thematic map was created by Edmond Halley in 1686, which depicted the trade winds and monsoons across the world's oceans. In the 19th century, with the advent of statistical data collection, thematic maps became a crucial tool for understanding complex social and natural phenomena.
Types of Thematic Maps
There are several types of thematic maps, each designed to represent specific types of data:
Choropleth Maps
Choropleth maps display divided geographic areas that are colored or patterned in relation to a data variable. This type of map provides an easy way to visualize how a measurement varies across a geographic area or it shows the level of the variable within pre-defined regions.
Dot Maps
Dot maps use a dot symbol to show the presence of a feature or phenomenon. Dot maps rely on a visual scatter to show spatial pattern.
Proportional Symbol Maps
Proportional symbol maps scale the size of simple symbols (usually a circle or square) proportionally to the data value found at that location.
Isarithmic Maps
Isarithmic maps use smoothed contour lines to represent a continuous surface.
Flow Maps
Flow maps show the movement of objects from one location to another, such as the number of people in a migration, the amount of goods being traded, or the number of packets in a network.
Creation of Thematic Maps
Creating a thematic map involves several steps, including data collection, data processing, and map design. The first step, data collection, involves gathering the necessary data to be displayed on the map. This data can be collected through surveys, censuses, or other data collection methods. Once the data has been collected, it must be processed to be suitable for display on a map. This involves cleaning the data, normalizing it, and possibly aggregating it. Finally, the map design process involves choosing the appropriate type of map, selecting a color scheme, and adding any necessary labels or legends.
Use and Importance
Thematic maps are used in a variety of fields, including geography, planning, and social sciences. They are particularly useful in visualizing complex data sets, allowing researchers and decision-makers to see patterns and trends that might not be immediately apparent in the raw data. By providing a visual representation of data, thematic maps can help to inform policy decisions, guide research, and educate the public.
See Also


