Dot map
Introduction
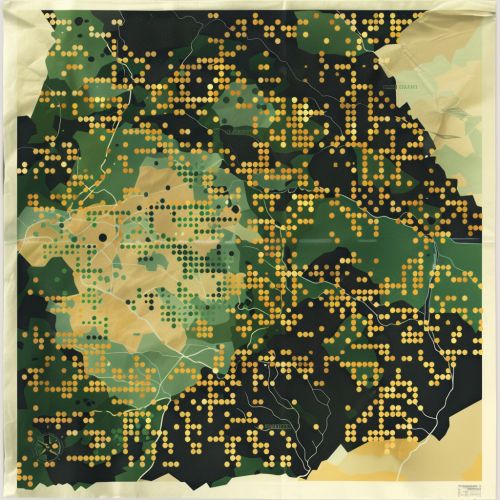
A dot map, also known as a dot distribution map or dot density map, is a type of thematic map that uses a dot symbol to show the presence of a feature or phenomenon. Dot maps rely on visual scatter to show spatial pattern. Each dot represents a specified quantity of the mapped feature in the area where the dot is placed GIS.
History
The first known dot map was published in 1854 by John Snow, a British physician. Snow used the map to illustrate the connection between the locations of cholera deaths and a contaminated water pump in London's Soho district. This map is often credited as one of the earliest examples of spatial analysis, and it played a crucial role in the development of modern epidemiology epidemiology.
Design and Construction
The design and construction of a dot map involve several steps. First, the mapmaker must choose a suitable base map that accurately represents the geographic area to be mapped. The base map should include all relevant geographic features, such as roads, rivers, and political boundaries cartography.
Next, the mapmaker must decide on the scale of the map and the size of the dots. The scale of the map determines how much detail can be shown, while the size of the dots affects the map's readability. It's important to choose a dot size that is large enough to be easily seen, but not so large that it obscures other features on the map.
The mapmaker must also decide on the value that each dot will represent. This is known as the dot value or dot density. The dot value can be any number, but it should be chosen carefully to ensure that the map accurately represents the data.
Once these decisions have been made, the mapmaker can begin placing dots on the map. Each dot is placed at the location of the feature or phenomenon it represents. If the data is aggregated, such as in census data, the dots are randomly placed within the geographic area of the data.
Uses
Dot maps are used in a variety of fields, including geography, epidemiology, and social sciences. They are particularly useful for visualizing spatial patterns and distributions. For example, a dot map can be used to show the distribution of a population in a country, the locations of businesses in a city, or the spread of a disease in a region spatial analysis.
In geography, dot maps can be used to show the distribution of natural resources, such as forests, minerals, or water bodies. They can also be used to show the distribution of human-made features, such as cities, roads, or power lines.
In epidemiology, dot maps can be used to track the spread of diseases. By mapping the locations of disease cases, researchers can identify patterns and trends that may help them understand how the disease is spreading and where it may go next.
In the social sciences, dot maps can be used to visualize demographic data, such as the distribution of different ethnic groups in a city or the locations of different types of businesses in a neighborhood.
Advantages and Disadvantages
Dot maps have several advantages. They are relatively easy to create and understand, making them accessible to a wide range of users. They can also handle large amounts of data and can show detailed spatial patterns that might be difficult to see with other types of maps.
However, dot maps also have some disadvantages. One of the main disadvantages is that they can be misleading if the dot value is not carefully chosen. For example, a map with a high dot value might give the impression that a feature is more common than it actually is.
Another disadvantage is that dot maps can be difficult to interpret when the dots are close together. This is especially true for maps that show dense urban areas or other places with a high concentration of features.
Finally, dot maps can be misleading if the data is not accurately represented. For example, if the data is aggregated, the dots are randomly placed within the geographic area of the data. This can give the impression that the features are evenly distributed, even if they are not.
See Also


