Moran's I
Introduction
Moran's I is a measure of spatial autocorrelation developed by Patrick Alfred Pierce Moran. Spatial autocorrelation is the correlation of a variable with itself through space. Autocorrelation measures help detect patterns in data, which is particularly useful in fields such as geography, ecology, and epidemiology.


Definition
Moran's I is defined as:
I = n / S0 * Σi Σj wij (xi - x̄) (xj - x̄) / Σi (xi - x̄)²
where: - n is the number of spatial units indexed by i and j, - xi and xj are the variables of interest at locations i and j, - x̄ is the mean of x, - wij is a matrix of spatial weights, and - S0 is the aggregate of all the spatial weights.
Spatial Weights Matrix
The spatial weights matrix, W, is a key component of Moran's I. It defines the spatial relationship between locations. The weights can be binary (1 for neighboring locations, 0 otherwise) or based on the inverse distance between locations. The choice of weights can significantly influence the results of Moran's I.
Interpretation
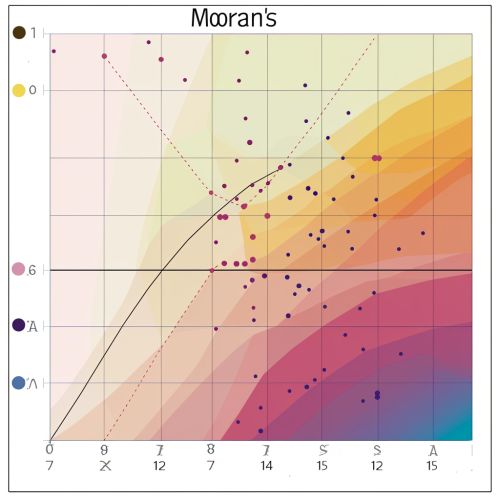
Moran's I values range from -1 (indicating perfect dispersion) to +1 (perfect correlation). A value close to zero indicates a random spatial pattern. The expected value of Moran's I under the null hypothesis of no spatial autocorrelation is -1/(n-1).
Significance Testing
The significance of Moran's I is usually tested using a permutation approach. The observed value is compared to the distribution of Moran's I values obtained by randomly permuting the spatial locations of the variable of interest. If the observed Moran's I is in the extreme of the distribution (either high or low), it can be concluded that the pattern is not likely to be random.
Applications
Moran's I is widely used in fields that deal with spatial data. In geography, it can help detect clusters of high or low values. In ecology, it can be used to analyze the distribution of species. In epidemiology, it can help identify disease hotspots.
Limitations
While Moran's I is a powerful tool, it has its limitations. It assumes a linear relationship between the variable of interest and its spatial lag. It is also sensitive to the choice of spatial weights. Furthermore, it does not provide information on the scale of spatial autocorrelation.
