Skewness
Introduction
Skewness is a statistical measure that describes the asymmetry of the probability distribution of a real-valued random variable about its mean. It quantifies the extent to which a distribution differs from a normal distribution, where the mean, median, and mode are all equal. Skewness is an essential concept in descriptive statistics, as it provides insights into the shape and nature of the data distribution.
Definition and Calculation
Skewness can be mathematically defined and calculated using different formulas, depending on the context and the nature of the data. The most common methods include the Pearson's first and second coefficients of skewness and the moment-based measure.
Pearson's Coefficients of Skewness
Pearson's first coefficient of skewness is calculated as: \[ \text{Skewness} = \frac{3(\text{Mean} - \text{Median})}{\text{Standard Deviation}} \]
Pearson's second coefficient of skewness is given by: \[ \text{Skewness} = \frac{\text{Mean} - \text{Mode}}{\text{Standard Deviation}} \]
These coefficients provide a simple way to measure skewness using the relationship between the mean, median, and mode.
Moment-Based Measure
The moment-based measure of skewness is defined as the third standardized moment about the mean: \[ \gamma_1 = \frac{\mu_3}{\sigma^3} \] where \( \mu_3 \) is the third central moment and \( \sigma \) is the standard deviation. This measure is more commonly used in statistical analysis and provides a more precise quantification of skewness.
Interpretation of Skewness
Skewness can be positive, negative, or zero, each indicating a different type of asymmetry in the distribution.
Positive Skewness
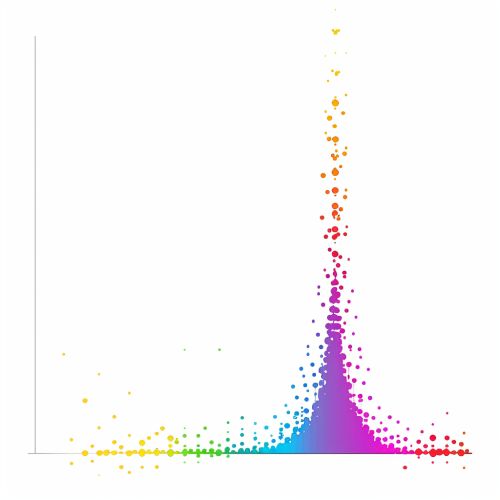
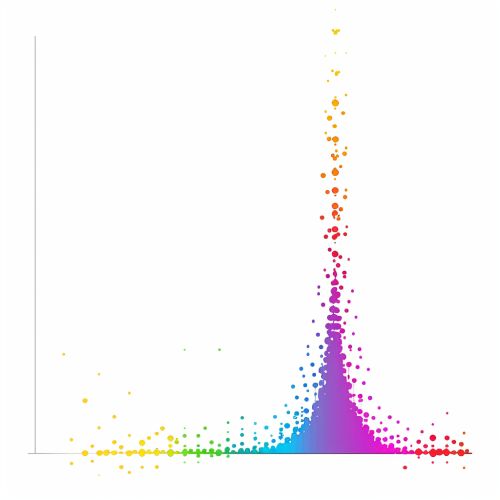
A distribution with positive skewness, also known as right-skewed, has a long tail on the right side. This indicates that the majority of the data points are concentrated on the left, with a few extreme values on the right. Examples of positively skewed distributions include income and wealth distributions, where a small number of individuals have significantly higher values than the rest.
Negative Skewness
A distribution with negative skewness, or left-skewed, has a long tail on the left side. This suggests that most data points are concentrated on the right, with a few extreme values on the left. An example of a negatively skewed distribution is the age at retirement, where most individuals retire around a certain age, but a few retire much earlier.
Zero Skewness
A distribution with zero skewness is perfectly symmetrical, indicating that the data is evenly distributed around the mean. This is characteristic of a normal distribution.
Applications of Skewness
Skewness is widely used in various fields to understand the nature of data distributions and to make informed decisions based on the shape of the data.
Finance
In finance, skewness is used to assess the risk and return profiles of investments. Positively skewed returns indicate that there is a higher probability of achieving returns above the mean, while negatively skewed returns suggest a higher likelihood of returns below the mean. This information is crucial for portfolio management and risk assessment.
Quality Control
In quality control, skewness helps identify deviations from the desired product specifications. A skewed distribution of product measurements can indicate issues in the manufacturing process that need to be addressed to ensure consistent quality.
Environmental Science
Environmental scientists use skewness to analyze data related to pollution levels, weather patterns, and other environmental factors. Skewed distributions can reveal the presence of outliers or extreme events that may have significant impacts on the environment.
Mathematical Properties of Skewness
Skewness has several mathematical properties that are important for understanding its behavior and implications.
Relationship with Moments
Skewness is related to the moments of a distribution. The third central moment, in particular, plays a crucial role in determining the skewness. Higher-order moments can also provide additional insights into the shape and characteristics of the distribution.
Invariance under Linear Transformations
Skewness is invariant under linear transformations of the form \( Y = aX + b \), where \( a \) and \( b \) are constants. This means that scaling or shifting the data does not affect the skewness, making it a robust measure for comparing distributions with different units or scales.
Sensitivity to Outliers
Skewness is sensitive to outliers, as extreme values can significantly impact the measure. This sensitivity makes skewness a useful tool for detecting the presence of outliers in a dataset.
Estimation of Skewness
Estimating skewness from sample data involves calculating the sample skewness, which is an unbiased estimator of the population skewness.
Sample Skewness
The sample skewness is calculated as: \[ g_1 = \frac{n}{(n-1)(n-2)} \sum_{i=1}^{n} \left( \frac{X_i - \bar{X}}{s} \right)^3 \] where \( n \) is the sample size, \( X_i \) is the \( i \)-th data point, \( \bar{X} \) is the sample mean, and \( s \) is the sample standard deviation. This formula adjusts for the bias that can occur in small samples.
Bias and Variance of Sample Skewness
The sample skewness has a certain bias and variance, which can affect its accuracy as an estimator of the population skewness. Various methods, such as bootstrapping, can be used to assess and correct for these biases.
Skewness in Different Distributions
Different types of distributions exhibit varying levels of skewness, which can provide insights into their characteristics and behavior.
Normal Distribution
A normal distribution has zero skewness, indicating perfect symmetry. The mean, median, and mode are all equal, and the distribution is bell-shaped.
Exponential Distribution
The exponential distribution is an example of a positively skewed distribution. It has a long right tail, with most values concentrated near the lower end.
Log-Normal Distribution
The log-normal distribution is another example of a positively skewed distribution. It is commonly used to model financial data, such as stock prices and income levels.
Beta Distribution
The beta distribution can exhibit both positive and negative skewness, depending on its parameters. It is a versatile distribution used in various fields, including Bayesian statistics and project management.
Practical Considerations
When working with skewness, several practical considerations should be taken into account to ensure accurate and meaningful analysis.
Data Transformation
In some cases, transforming the data can help reduce skewness and make the distribution more symmetrical. Common transformations include the logarithmic, square root, and Box-Cox transformations.
Robustness to Outliers
Given its sensitivity to outliers, skewness should be interpreted with caution in the presence of extreme values. Robust statistical methods, such as trimmed means and Winsorization, can help mitigate the impact of outliers.
Interpretation in Context
The interpretation of skewness should always be done in the context of the specific application and the nature of the data. Different fields may have different thresholds for what constitutes significant skewness, and the implications of skewness can vary depending on the context.
Conclusion
Skewness is a fundamental statistical measure that provides valuable insights into the asymmetry and shape of data distributions. Understanding skewness and its implications is crucial for accurate data analysis and informed decision-making in various fields. By considering the mathematical properties, estimation methods, and practical considerations, researchers and analysts can effectively utilize skewness to gain a deeper understanding of their data.


