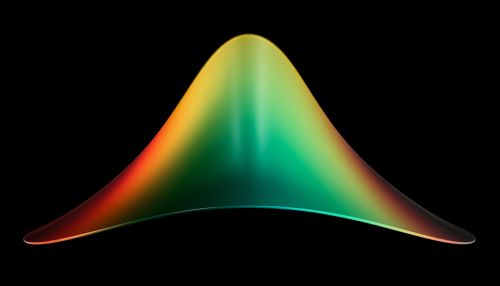
Normal Distribution
Introduction
The normal distribution, also known as the Gaussian distribution, is a type of continuous probability distribution for a real-valued random variable. It is a fundamental concept in the field of statistics and is widely used in the natural and social sciences as a simple model for complex random variables.
Definition
The normal distribution is defined by two parameters: the mean (μ) and the standard deviation (σ). The mean is the center of the distribution, and the standard deviation measures the spread or "width" of the distribution. The probability density function of a normal distribution with mean μ and standard deviation σ is given by:
- f(x) = (1 / √(2πσ²)) * e^(-(x-μ)² / (2σ²))
where e is the base of the natural logarithm, and π is Pi, a fundamental constant in mathematics.
Properties
The normal distribution has several important properties.
Symmetry
The normal distribution is symmetric about its mean. This means that the left and right halves of the distribution are mirror images of each other.
Mean, Median, and Mode
For a normal distribution, the mean, median, and mode are all equal to each other and located at the center of the distribution.
68-95-99.7 Rule
Approximately 68% of the data falls within one standard deviation of the mean, 95% falls within two standard deviations, and 99.7% falls within three standard deviations. This is known as the empirical rule or the 68-95-99.7 rule.
Applications
The normal distribution is widely used in statistics and the natural and social sciences as a simple model for complex random variables. Some of the applications include:
Hypothesis Testing
In hypothesis testing, the normal distribution is used to calculate p-values, or the probability of observing a test statistic as extreme as the one calculated, assuming the null hypothesis is true.
Confidence Intervals
In confidence intervals, the normal distribution is used to calculate the range of values within which the true population parameter lies with a certain level of confidence.
Quality Control
In quality control, the normal distribution is used to understand variation and to set acceptable ranges for product measurements.
Limitations
While the normal distribution is widely used, it is not without its limitations. Some of these include:
Not Suitable for All Data
The normal distribution is not suitable for all types of data. For example, it is not suitable for data that is skewed or has heavy tails.
Sensitive to Outliers
The normal distribution is sensitive to outliers, which can greatly affect the mean and standard deviation.
Assumes Independence
The normal distribution assumes that all observations are independent of each other. This is often not the case in real-world data.
See Also
- Central limit theorem
- Standard normal distribution
- Z-score
- Probability density function
- Skewness
- Kurtosis


