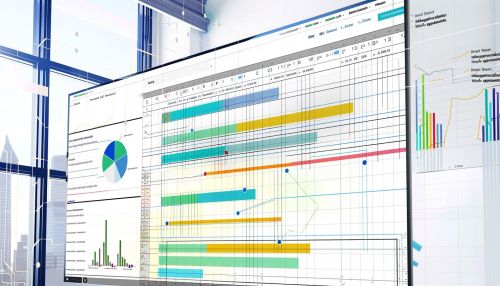
Gantt Chart
Introduction
A Gantt Chart is a type of bar chart that illustrates a project schedule. Named after its inventor, Henry Gantt, who designed this chart around the years 1910–1915, it has become a common project management tool. It is used to depict the start and finish dates of the terminal elements and summary elements of a project.
History
Henry Gantt, an American mechanical engineer and management consultant, devised the Gantt chart during the 1910s. His aim was to provide a visual solution to represent the progression of a project. Gantt charts were initially used for simple tasks, but as the complexity of projects increased, so did the complexity of the charts.
Structure and Usage
A Gantt chart is constructed with a horizontal axis representing the total time span of the project, broken down into increments (for example, days, weeks, or months) and a vertical axis representing the tasks that make up the project. Horizontal bars of varying lengths represent the sequences, timing, and time span for each task. Using a Gantt chart, one can see what the various activities are, when each activity begins and ends, how long each activity is scheduled to last, where activities overlap with other activities, and by how much, and the start and end date of the whole project.
Advantages
Gantt charts have several advantages. They provide a visual representation of the project schedule, where tasks are displayed against time. This allows project managers to see the duration of each task, identify overlapping tasks and understand the overall structure of the project. Gantt charts also allow for easy updates and adjustments, as project timelines change. They also facilitate communication among team members and with stakeholders, as they provide a clear and easy-to-understand picture of the project.
Limitations
Despite their advantages, Gantt charts also have some limitations. They can become overly complex for large projects, where hundreds of tasks and subtasks may exist. This can make the chart difficult to interpret and manage. Furthermore, Gantt charts do not represent the size of the project or the relative size of individual tasks. A short bar may represent a small task that takes little time, but requires many resources, whereas a long bar may represent a task that takes a lot of time but requires few resources.
Variations
There are several variations of Gantt charts, each with their own specific uses. These include the PERT chart (Program Evaluation and Review Technique), which is used to analyze the tasks involved in completing a given project, especially the time needed to complete each task, and the critical path and slack time for the tasks. Another variation is the Critical Path Method (CPM) chart, which is used to schedule and manage complex projects.
Software
There are numerous software applications and online tools available that can generate Gantt charts. These range from standalone applications to project management suites, and from desktop software to mobile apps. Some of the popular Gantt chart software includes Microsoft Project, Primavera, and numerous online tools like Smartsheet and ProjectManager.com.
Conclusion
Gantt charts are an essential tool in project management. They provide a visual representation of the project timeline, tasks, and their respective durations. Despite their limitations, Gantt charts are widely used due to their simplicity and effectiveness in communicating project timelines.


