File:Detail-37193.jpg
Size of this preview: 600 × 600 pixels. Other resolutions: 480 × 480 pixels | 1,024 × 1,024 pixels.
Original file (1,024 × 1,024 pixels, file size: 392 KB, MIME type: image/jpeg)
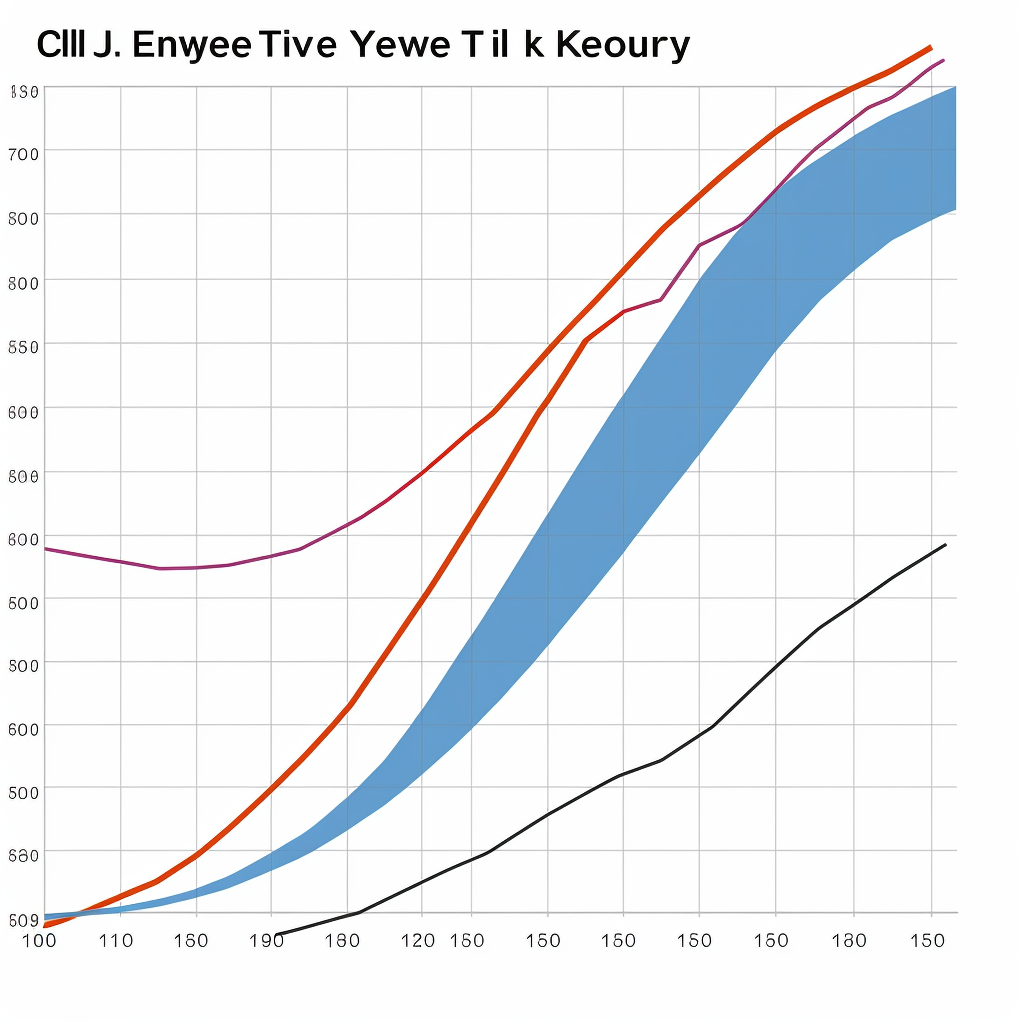
A graph showing a typical logistic growth curve, with population size on the y-axis and time on the x-axis.
File history
Click on a date/time to view the file as it appeared at that time.
| Date/Time | Thumbnail | Dimensions | User | Comment | |
|---|---|---|---|---|---|
| current | 16:26, 13 November 2023 | | 1,024 × 1,024 (392 KB) | Ai (talk | contribs) | A graph showing a typical logistic growth curve, with population size on the y-axis and time on the x-axis. |
You cannot overwrite this file.
File usage
The following page uses this file: