Feynman diagrams
Introduction
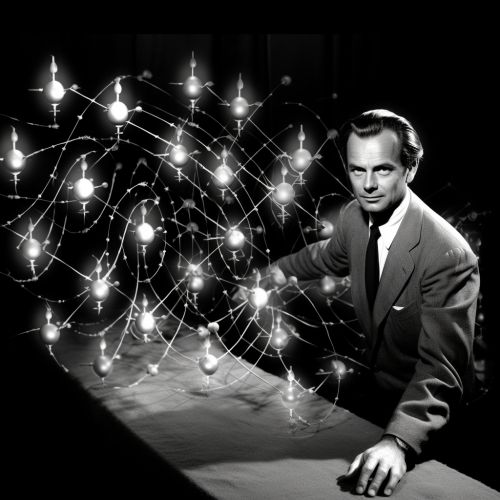
Feynman diagrams are graphical representations of the mathematical expressions describing the behavior of subatomic particles. Named after their creator, Richard Feynman, a prominent American physicist, these diagrams have become a fundamental tool in quantum field theory, a branch of physics that combines quantum mechanics and special relativity to describe the interactions of particles.


History and Development
Feynman diagrams were first introduced in the late 1940s by Richard Feynman. His goal was to provide a clear and intuitive way to depict processes in quantum field theory, such as the scattering of particles or the creation and annihilation of particle-antiparticle pairs.
Feynman's diagrams were initially met with skepticism by the scientific community. However, they were soon recognized as a powerful tool for calculating and visualizing particle interactions, and they have since become a standard method in the field.


Basic Elements of Feynman Diagrams
A Feynman diagram consists of several basic elements: lines, vertices, and loops.


Lines
Lines in a Feynman diagram represent particles. There are three types of lines: straight lines, wavy lines, and dashed lines. Straight lines represent fermions, which include particles like electrons and quarks. Wavy lines represent bosons, such as photons and gluons. Dashed lines are typically used to represent scalar particles, like the Higgs boson.
Vertices
Vertices in a Feynman diagram represent points where particles interact. Each vertex must conserve certain quantities, such as energy and momentum, in accordance with the laws of physics.
Loops
Loops in a Feynman diagram represent virtual particles, which are temporary fluctuations in the energy and momentum of a system. These particles exist only for a brief moment and cannot be directly observed.
Interpretation of Feynman Diagrams
Feynman diagrams are not meant to be literal pictures of what happens during a particle interaction. Instead, they are a visual tool for organizing and calculating the terms in the mathematical expressions that describe these interactions.


Applications of Feynman Diagrams
Feynman diagrams have a wide range of applications in theoretical physics. They are used to calculate the probabilities of different outcomes in particle collisions, to study the properties of quantum fields, and to develop new theories of particle interactions.


