Data Flow Diagram
Overview
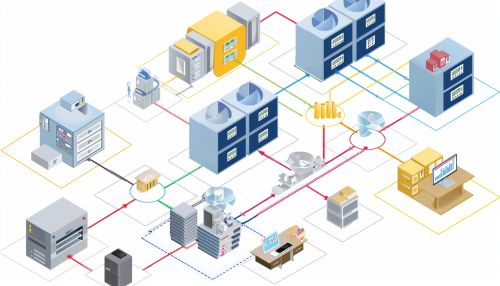
A **Data Flow Diagram (DFD)** is a graphical representation used to visualize the flow of data within a system. It illustrates how data is processed by a system in terms of inputs and outputs. DFDs are widely used in systems analysis and design to provide a clear and concise method for depicting the flow of information. They are particularly useful for understanding complex systems and for identifying potential points of improvement.
History and Development
The concept of Data Flow Diagrams was introduced by Larry Constantine as part of structured design, a method for developing systems and software. The technique gained popularity in the 1970s and 1980s as part of the structured systems analysis and design methodology (SSADM). Over the years, DFDs have evolved and have been integrated into various methodologies, including the Unified Modeling Language (UML).
Components of a Data Flow Diagram
DFDs consist of four primary components:
1. **Processes**: Represented by circles or ovals, processes depict the transformation of data within the system. Each process should have a unique name and a number for identification. 2. **Data Stores**: Represented by open-ended rectangles or parallel lines, data stores indicate where data is held within the system. They can represent databases, files, or any other storage medium. 3. **Data Flows**: Represented by arrows, data flows show the direction of data movement between processes, data stores, and external entities. Each data flow should be labeled with the type of data it carries. 4. **External Entities**: Represented by rectangles, external entities are outside the system but interact with it. They can be users, other systems, or organizations.
Levels of Data Flow Diagrams
DFDs can be divided into different levels to represent varying degrees of detail:
Context Diagram
The highest level of a DFD is the context diagram, which provides an overview of the entire system. It shows the system as a single process and its interactions with external entities. This level is useful for understanding the system's boundaries and scope.
Level 0 Diagram
A Level 0 DFD, also known as a fundamental system model or a context-level DFD, breaks down the single process of the context diagram into sub-processes. It provides a more detailed view of the system's major functions and data flows.
Level 1 and Beyond
Further levels of DFDs (Level 1, Level 2, etc.) decompose the processes into more detailed sub-processes. Each subsequent level provides a finer granularity of detail, helping to identify specific operations within the system.
Creating a Data Flow Diagram
Creating a DFD involves several steps:
1. **Identify the System's Boundaries**: Determine the scope of the system and its interactions with external entities. 2. **Identify Processes**: List all the processes that occur within the system. 3. **Identify Data Stores**: Determine where data is stored within the system. 4. **Identify Data Flows**: Map out the flow of data between processes, data stores, and external entities. 5. **Draw the Diagram**: Use the appropriate symbols to represent processes, data stores, data flows, and external entities.
Benefits of Data Flow Diagrams
DFDs offer several advantages:
- **Clarity**: They provide a clear and concise way to represent the flow of data within a system. - **Communication**: DFDs facilitate communication between stakeholders, including developers, analysts, and users. - **Problem Identification**: They help identify potential issues and inefficiencies within a system. - **Documentation**: DFDs serve as valuable documentation for system design and maintenance.
Limitations of Data Flow Diagrams
Despite their benefits, DFDs have some limitations:
- **Complexity**: For large systems, DFDs can become complex and difficult to manage. - **Static Representation**: DFDs do not capture the dynamic behavior of a system. - **Ambiguity**: Without proper labeling and documentation, DFDs can be open to interpretation.
Best Practices for Data Flow Diagrams
To maximize the effectiveness of DFDs, consider the following best practices:
- **Consistency**: Ensure that symbols and notations are used consistently throughout the diagram. - **Simplicity**: Keep the diagram as simple as possible while still conveying the necessary information. - **Iteration**: Create multiple iterations of the DFD to refine and improve its accuracy. - **Validation**: Validate the DFD with stakeholders to ensure it accurately represents the system.
Applications of Data Flow Diagrams
DFDs are used in various fields, including:
- **Software Engineering**: To design and analyze software systems. - **Business Process Modeling**: To map out and improve business processes. - **Systems Analysis**: To understand and document existing systems. - **Education**: To teach systems analysis and design concepts.
Example of a Data Flow Diagram


