Data Analysis
Introduction
Data analysis is a process of inspecting, cleansing, transforming, and modeling data with the goal of discovering useful information, informing conclusions, and supporting decision-making. Data analysis has multiple facets and approaches, encompassing diverse techniques under a variety of names, and is used in different business, science, and social science domains. In today's business world, data analysis plays a role in making decisions more scientific and helping businesses operate more effectively.


Data Collection
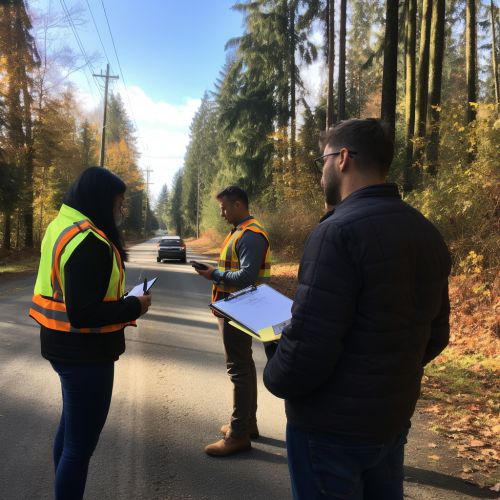
Data collection is the process of gathering and measuring information on targeted variables in an established systematic fashion, which then enables one to answer relevant questions and evaluate outcomes. Data collection is a component of research methods. It is an important aspect of any type of research study. Inaccurate data collection can impact the results of a study and ultimately lead to invalid results.


Data Cleaning
Data cleaning, also known as data cleansing or data scrubbing, is the process of ensuring that a set of data is correct and usable by identifying any errors or corruptions in the data, correcting or deleting them, or manually processing the data as needed to prevent the same errors from occurring in the future.


Data Transformation
Data transformation is the process of converting data from one format or structure into another format or structure. It is a fundamental aspect of most data integration and data management tasks such as data wrangling, data warehousing, data integration and application integration.


Data Modeling
Data modeling in software engineering is the process of creating a data model by applying formal data model descriptions using data modeling techniques. Data modeling is a technique for defining business requirements for a database. It is sometimes called database modeling because a data model is eventually implemented in a database.


Data Visualization
Data visualization is the graphical representation of information and data. By using visual elements like charts, graphs, and maps, data visualization tools provide an accessible way to see and understand trends, outliers, and patterns in data. In the world of Big Data, data visualization tools and technologies are essential to analyze massive amounts of information and make data-driven decisions.


Conclusion
In conclusion, data analysis is a complex process with many components. It is an essential part of making informed, data-driven decisions in business and research. With the increasing availability and complexity of data, the need for data analysis skills is more prominent than ever.
