Penrose Diagram: Difference between revisions
(Created page with "== Introduction == A Penrose diagram is a two-dimensional graphical representation of a spacetime that captures its causal structure. Named after the British physicist Roger Penrose, these diagrams are particularly useful in the study of general relativity and cosmology, as they allow for the visualization of infinite regions of spacetime in a finite manner. Penrose diagrams are often employed to analyze the causal relationships between different events...") |
No edit summary |
||
| Line 45: | Line 45: | ||
Penrose diagrams are invaluable tools in the study of general relativity and cosmology. By providing a compact and intuitive representation of the causal structure of spacetime, they enable physicists to explore complex phenomena such as black holes and cosmological singularities. Despite their limitations, Penrose diagrams continue to play a crucial role in advancing our understanding of the universe. | Penrose diagrams are invaluable tools in the study of general relativity and cosmology. By providing a compact and intuitive representation of the causal structure of spacetime, they enable physicists to explore complex phenomena such as black holes and cosmological singularities. Despite their limitations, Penrose diagrams continue to play a crucial role in advancing our understanding of the universe. | ||
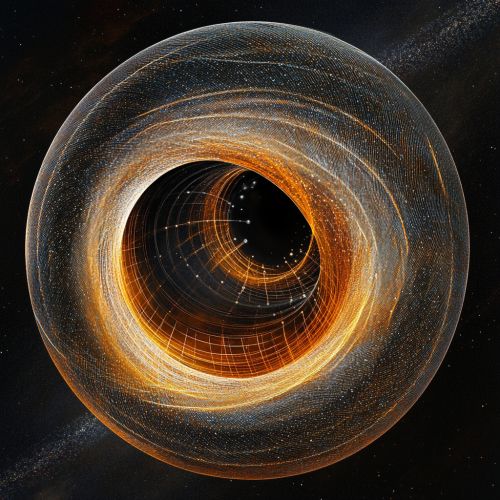
[[Image:Detail-98537.jpg|thumb|center|A detailed artistic representation of a Penrose diagram showing the causal structure of a Schwarzschild black hole, with light cones and event horizons clearly depicted.|class=only_on_mobile]] | |||
[[Image:Detail-98538.jpg|thumb|center|A detailed artistic representation of a Penrose diagram showing the causal structure of a Schwarzschild black hole, with light cones and event horizons clearly depicted.|class=only_on_desktop]] | |||
== See Also == | == See Also == | ||
Latest revision as of 00:02, 19 October 2024
Introduction
A Penrose diagram is a two-dimensional graphical representation of a spacetime that captures its causal structure. Named after the British physicist Roger Penrose, these diagrams are particularly useful in the study of general relativity and cosmology, as they allow for the visualization of infinite regions of spacetime in a finite manner. Penrose diagrams are often employed to analyze the causal relationships between different events in spacetime, particularly in the context of black holes and cosmological models.
Construction of Penrose Diagrams
Penrose diagrams are constructed by performing a conformal transformation on the spacetime metric. This transformation preserves the angles between curves but not their lengths, allowing for the compression of infinite distances into finite ones. The key feature of a Penrose diagram is that light rays travel at 45-degree angles, which facilitates the analysis of causal relationships.
To construct a Penrose diagram, one typically follows these steps:
1. **Identify the Metric:** Begin with the spacetime metric of interest. For example, the Schwarzschild metric describes the spacetime around a non-rotating black hole.
2. **Conformal Transformation:** Apply a conformal transformation to the metric. This involves a change of coordinates that compresses infinite distances.
3. **Compactification:** Map the transformed spacetime onto a finite region, typically a square or rectangle, where the boundaries represent infinity.
4. **Plot Causal Structure:** Draw the light cones at 45-degree angles to represent the paths of light rays. This helps in visualizing the causal structure of the spacetime.
Applications in Black Hole Physics
Penrose diagrams are extensively used in the study of black holes. They provide insights into the causal structure of the event horizon, the singularity, and the asymptotic regions of spacetime. For instance, the Penrose diagram for a Schwarzschild black hole reveals the presence of an event horizon and a singularity, and shows how these features affect the paths of light and matter.
In the case of a Kerr black hole, which describes a rotating black hole, the Penrose diagram becomes more complex due to the presence of an ergosphere and multiple event horizons. These diagrams help physicists understand phenomena such as the Penrose process, a mechanism by which energy can be extracted from a rotating black hole.
Penrose Diagrams in Cosmology
In cosmology, Penrose diagrams are used to study the global structure of the universe. They can represent different cosmological models, such as the Friedmann-Lemaître-Robertson-Walker (FLRW) metric, which describes a homogeneous and isotropic universe. Penrose diagrams for these models illustrate the causal structure of the universe, including the big bang and potential big crunch scenarios.
One of the intriguing applications of Penrose diagrams in cosmology is the study of cosmic censorship and the nature of singularities. By analyzing the causal structure of different cosmological models, physicists can explore whether singularities are always hidden behind event horizons, as proposed by the cosmic censorship hypothesis.
Mathematical Foundations
The mathematical foundation of Penrose diagrams lies in the theory of conformal geometry. Conformal transformations are a type of diffeomorphism that preserve angles but not distances. This property is crucial for the construction of Penrose diagrams, as it allows for the representation of infinite regions in a finite manner.
The use of conformal transformations in Penrose diagrams is closely related to the concept of conformal infinity, which refers to the boundary of spacetime at infinity. By mapping this boundary onto a finite region, Penrose diagrams make it possible to study the asymptotic structure of spacetime.
Limitations and Challenges
While Penrose diagrams are powerful tools for visualizing the causal structure of spacetime, they have limitations. One challenge is that they can become complex and difficult to interpret for spacetimes with intricate structures, such as those involving multiple interacting black holes or highly anisotropic cosmological models.
Additionally, Penrose diagrams are primarily qualitative tools. They provide insights into the causal relationships between events but do not offer quantitative information about distances or timescales. As a result, they are often used in conjunction with other analytical and numerical methods in the study of general relativity.
Conclusion
Penrose diagrams are invaluable tools in the study of general relativity and cosmology. By providing a compact and intuitive representation of the causal structure of spacetime, they enable physicists to explore complex phenomena such as black holes and cosmological singularities. Despite their limitations, Penrose diagrams continue to play a crucial role in advancing our understanding of the universe.


